Fluoridated Cities & States
Largest Fluoridated Cities
Forty-two of the fifty largest cities in the U.S. are supplied with fluoridated water.
Forty-two of the fifty largest cities in the U.S. are supplied with fluoridated water.
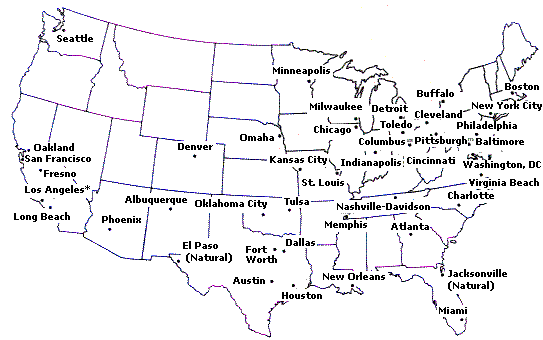
Two cities (Jacksonville, Florida, and El Paso, Texas) are naturally fluoridated.
*Los Angeles, California, plans to implement fluoridation in early 1999.
Information current as of November 1998.
*Los Angeles, California, plans to implement fluoridation in early 1999.
Information current as of November 1998.
State Fluoridation Status
States with 75% of the population served by fluoridated community water supplies.*
States with 75% of the population served by fluoridated community water supplies.*
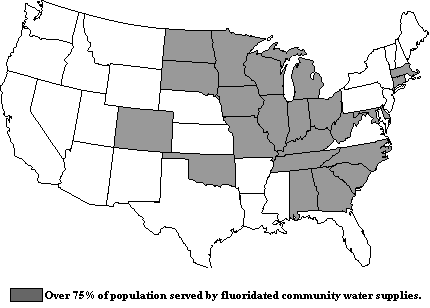
*Data compiled by the American Dental Association and the Centers for Disease Control and Prevention/Division of Oral Health.
Current as of November 1998.
Current as of November 1998.
Fluoridation Statistics 2002:
Status of Water Fluoridation by State
Percentage of state populations on public water systems receiving fluoridated water and state rank
Data Source: 2002 Water Fluoridation Reporting System (WFRS)
Status of Water Fluoridation by State
Percentage of state populations on public water systems receiving fluoridated water and state rank
Data Source: 2002 Water Fluoridation Reporting System (WFRS)
[Articles][Letters][Professionals][Silicofluorides & Lead][Unusually Susceptible][Rejection][Geography][Links]
|
|
|||||||||||||||||||||||||||||||||||||||||||||||||||||||||||||||||||||||||||||||||||||||||||||||||||||||||||||||||||||||||||||||||||||||||||||||||||||||||||||||||||||||||||||||||||||||||||||||||||||||||||||||||||||||||||||||||||||||||||||||||||||||||||||||||||||||||||||||||||||||||||||||||||||||||||||||||||||||||||||||||||||